
A couple of years ago, Adam Fletcher, Chairman of both the UK’s Electronics Components Supply Network (ecsn) and the International Distributors of Electronics Association (IDEA) sat on a panel alongside a number of leading global electronic components market analysts. The consensus opinion of the panel was that meaningful growth would return to our industry in H2’24, a welcome prelude to strong, consistent growth in 2025. They got it wrong!
In this article, Fletcher explains that despite high levels of new design activity and widely expressed positive customer sentiment for the future of our industry, little of this optimism is apparent in the statistics published by industry associations such as ecsn/ IDEA or reflected in the financial results of publicly traded organisations across our market.
So, what went wrong?
Back in 2022/3 industry analysts were optimistic that demand from system integrators (customers) would return to near previous industry levels in 2024/5, broadly in line with established market patterns. In fact, we’ve seen zero recovery in overall demand for electronic components and, to date, the results continue to be very disappointing. Much of this can be put down to the global economy, that for the last few years has been much weaker than anticipated, but some can be attributed to the COVID-19 pandemic, during which customers grossly over ordered electronic components. Such was the extent of this over ordering that five years on, manufacturers of electronic components, the authorised distributors that represent them, and the customers they serve all hold hugely inflated in-house inventories of ageing components.
A number of questions come to mind: were customers legitimately trying to protect the best interests of their organisations or was it commercial greed that triggered the over-ordering? Should component manufacturers and their authorised distributors have accepted what they knew to be unusually high order levels? Did introducing NCNR (noncancellable-non-returnable) orders in a bid to reduce speculative purchasing activity only amplify the ‘phantom/ fictitious’ demand? And more recently, has the imposition of US tariffs further destabilised global trade?
It would be easy to point the finger of blame at specific activities and specific organisations, but I suspect that many other factors contributed to the ‘perfect storm’ that is currently affecting over half a million global customers. Our industry will eventually stabilise, but it’s an expensive, painful, and long-term process.
UK and Ireland – h1 2025 results
Manufacturers of electronic components and their authorised distributors closely monitor a number of key industry metrics, among which ‘Bookings’ (Net New Orders entered), ‘Billings’ (Net Invoices Raised on Shipment), and the relationship between the two known as the ‘Book to Bill (B2B) ratio’ are particularly valued by company executives, primarily because they provide an insight into the performance of their organisation and the overall market, but also because in the past they’ve proved to be useful indicators of future trends.
At the end of each year, members of the ecsn collaborate to arrive at a consensus view on the likely outcome for the year and provide a forecast for the coming year. Trying to distil a wide range of business opinions into a consensus view that all parties to the process are happy to endorse is always a challenge but over the past 25 years our members’ forecasts have been >75% accurate, a track record significantly better than many other forecasters have delivered!
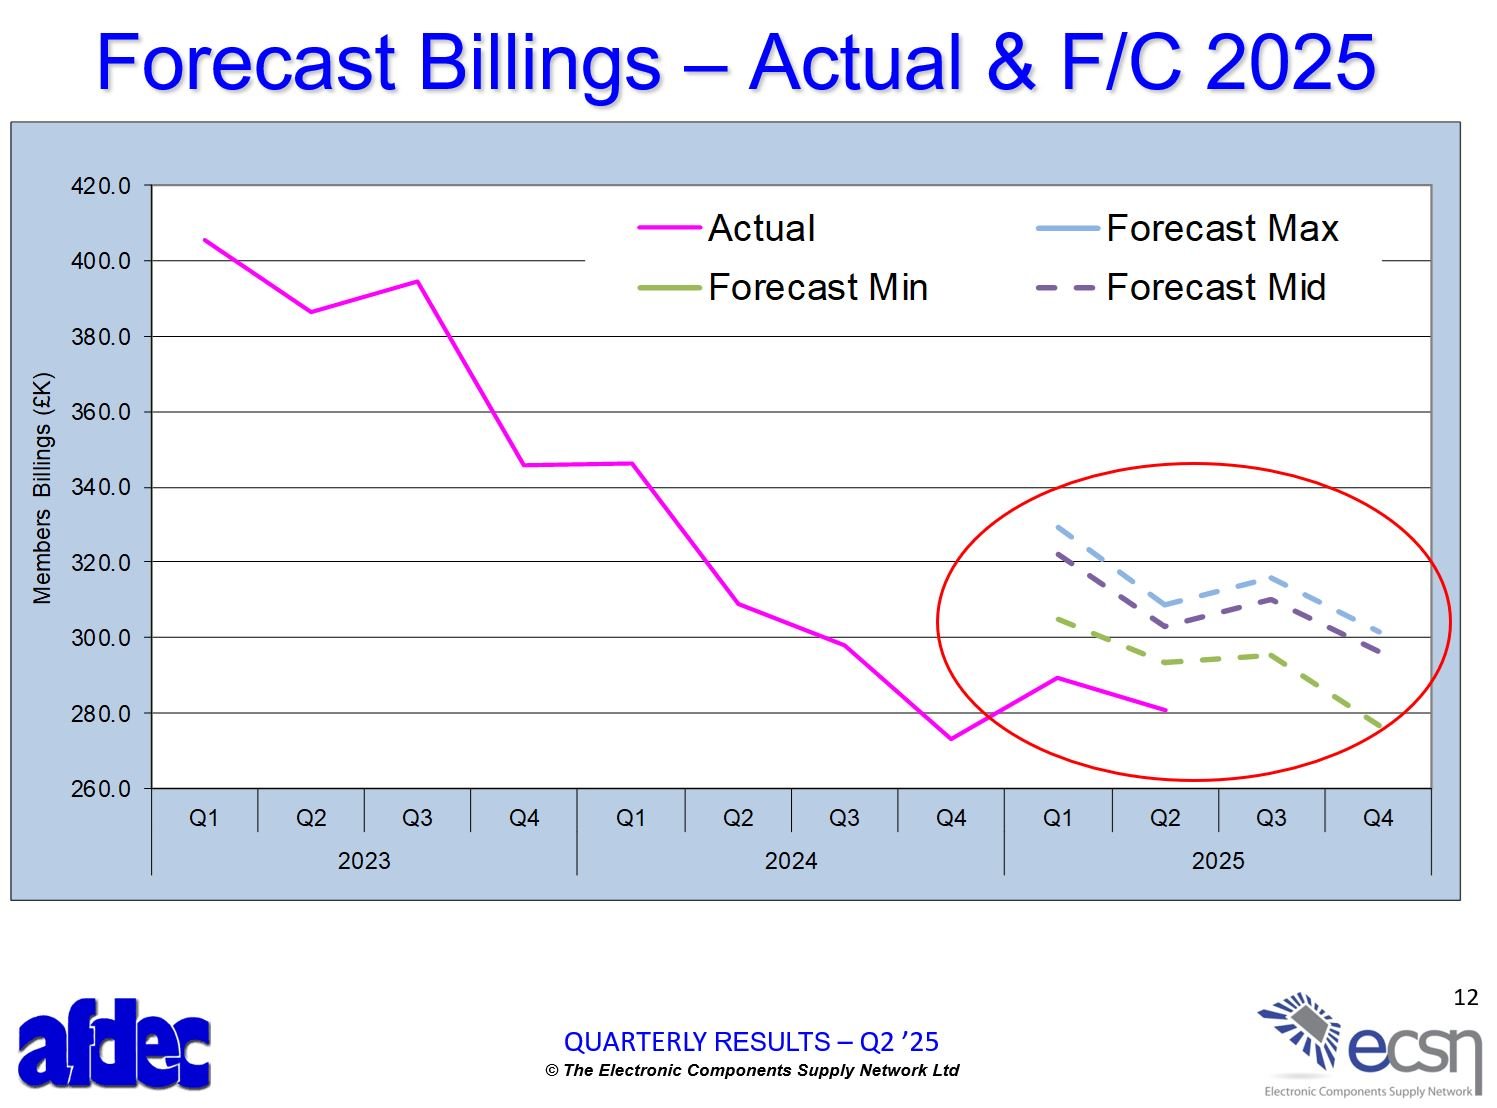
The graphic ‘Forecast Billings – Actual and F/C 2025’ clearly shows that the UK/Ireland electronic components market is struggling to make any meaningful recovery. Compiled from the latest members’ returns the ‘pink’ line plots actual UK Billings (sales revenue) by quarter and shows a decline throughout 2023 and 2024, a brief return to growth in Q1’25 before declining again in the following quarter. Our members believe that H2’25 is likely to be ‘flat’ at best, but this is not unusual for quarters 3 & 4 each year, and unfortunately there’s nothing to indicate that this pattern is likely to change any time soon.
The ‘red circle’ in the graphic displays what ecsn members’ predicted would be the minimum, maximum, and mid-point Billings values and clearly reveals the ‘miss’ between their expectation and reality. Authorised distributors support over 98% of the customer relationships in UK and Ireland electronic components markets so the amortised data compiled from our members’ monthly returns is both accurate and reliable.
IDEA – European statistical analysis in 2025
In common with many technology trade associations elsewhere in the world, the UK’s ecsn is a member of the International Distribution of Electronics Association (IDEA), an association of associations’ dedicated to establishing and promoting best industry practice. For over 20 years IDEA has collected a wide range of industry statistics directly from its members each month, which it compiles into reports that enable member management teams to accurately benchmark their organisation’s performance. Because these reports are broken down by subsets, including component type and geographic markets, the reports also provide a useful insight into overall industry trends. The graphic ‘2nd Quarter 2025 Total Components – Booking, Billing & Book to Bill Ratio’, which is best read from left to right, reveals a very similar performance in Europe to that of the UK. IDEA members serve close to 90% of the European DTAM (distributor total available market), so their statistics too are entirely reliable.
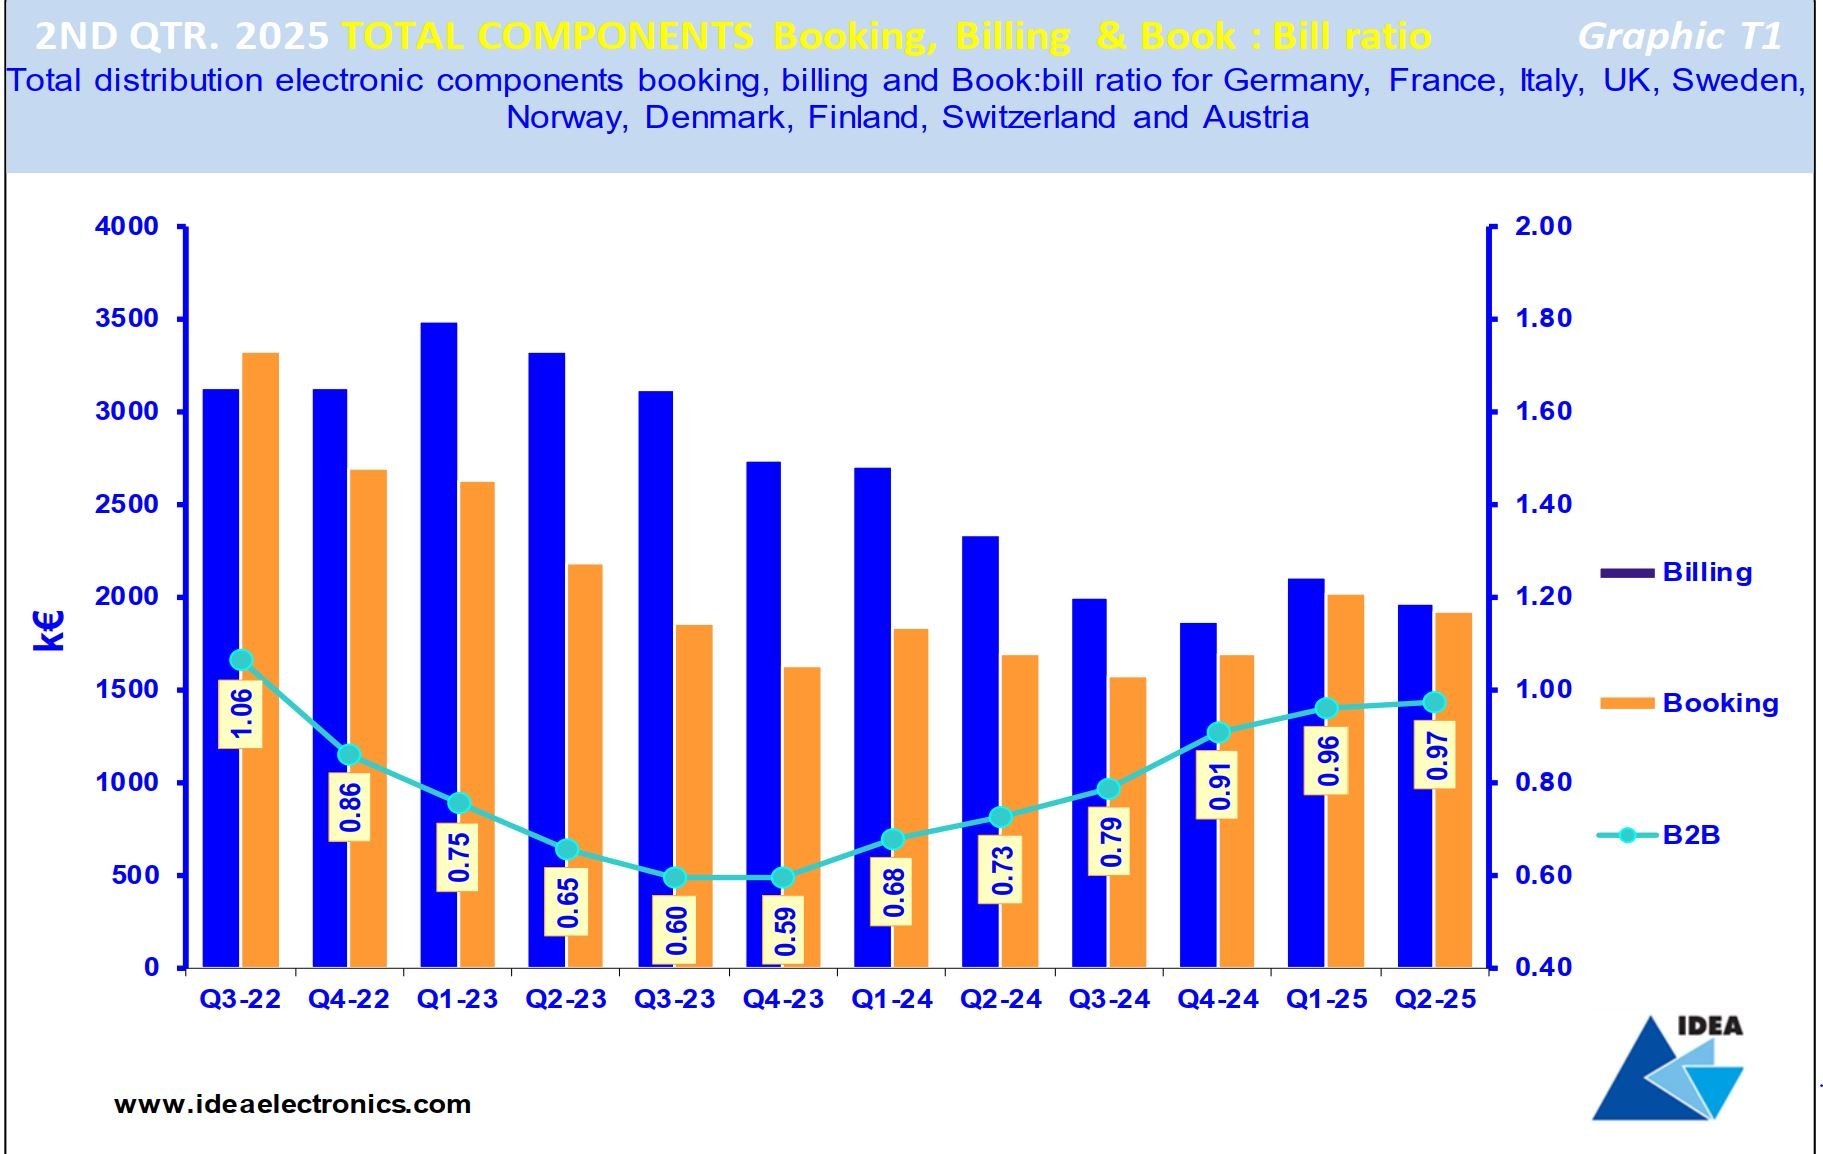
The blue bars show European ‘Billings’ (revenue from sales shipped and invoiced), which from Q2’22 grew for four consecutive quarters, peaking in Q1’23, before declining in the following seven quarters. It briefly returned to growth in the first quarter of this year but then declined again in Q2. The brown bars show European ‘Bookings’ (Net New Sales Revenue Entered), which declined in Q2’22 and continued to decline for ten consecutive quarters before returning to (low) growth in Q1’25 before declining again in the last reported quarter. In the last three months of 2021 (not included in the graphic) the B2B ratio peaked at 1.66:1, a simply outrageous number and beyond anything recorded in the past 40 years but contracted to 1.33:1 in Q2’22, then to 1.06:1 in the following quarter. The B2B ratio continued to contract over the following five quarters before gradually returning towards unity. The shape of the B2B curve over the last two years is indicative of a steadily improving trend (albeit on declining Billings) but until the B2B achieves a steady 1.05:1 it will not be possible to claim any return to market growth.
The full statistical analysis for the rest of the world (ROW) has not yet been published but anecdotal evidence and the information gleaned from industry executives suggest that only China and the Asia-Pac countries are able to claim any growth at all, and then only just! The US and Japan did experience growth in Q4’24 but it tailed off in the new year leaving only ‘spikes’ of growth caused by organisations pulling forward their material imports in an effort to avoid the huge tariff hikes proposed (threatened?) by the Trump administration.
Global market activity by sector
The only technology market sector reporting any real growth is Hyperscale Computing (AI), which is in turn driving demand for a long tail of supporting electronic components essential in modern power, infrastructure, and interconnect applications. AI is also encouraging the semiconductor market growth, but only in regard to a very small number of very specific, very high value devices. The lead-times for graphic processing units (GPUs) and high bandwidth memory devices remains unchanged at 26+ weeks.
Given the ongoing conflicts in Ukraine, Middle East, and Africa it’s no surprise that the aerospace and defence sector is reporting growth, but this market accounts for less than 5% of the total revenue derived from global sales of electronic components. The huge increase in demand for the specialised devices required by this sector is however pushing average lead-times for military qualified components out to 40+ weeks.
The biggest driver in our industry remains mobile phones and associated infrastructure (>60%) but here too growth continues to be disappointing, and the sector is struggling to stay out of negative territory. Anecdotal evidence suggests that consumers are finding few compelling reasons to upgrade their existing handsets and local country telecom providers are locking customers into much longer-term contracts, typically 24 months plus. Both factors have the effect of lengthening the replacement cycle, although from an environmental perspective that’s probably not a bad thing. The lead-times for the very high volumes of advanced electronic components required by the telecom sector remains at 20 weeks plus.
The global automotive market looks to be returning to growth, particularly with regard to plug-in vehicles. Asia is reporting a boom in sales of EVs but the overall automotive market in the US market is flat and the European market is also down, probably close to 15%. The post-COVID-19 inventory overhang in the automotive market in the ROW (particularly in Asia) appears to have been ‘cleansed’ and consumed, but here too the EU is lagging behind, probably by a calendar quarter. Lead-times for automotive components has also extended and today is averaging 18+ weeks but some outliers, principally specific simple microcontrollers are running at thirty plus weeks.
Industrial/medical markets continue to languish in the doldrums across all geographic markets as organisations defer investment until greater market certainty returns. The more mature technology electronic components typically required by this sector are generally running at a 16-week-plus lead-time, which is surprising.
Call to action
Members of ecsn in the UK are reporting ‘spot’ (very short term) buying activity by their customers seeking to carefully replenish their reducing inventories, or to cover specific shortages.
The current geopolitical situation and rising pricing for almost all electronic component types coupled with ongoing highly extended manufacturer lead-times suggests that procurement professionals need to adopt a more robust strategic procurement policy to ensure continuity of supply.
Procurement professionals must check their ERP systems and where necessary update it with the latest manufacturer lead-time data for the components their organisation is likely to require in H2’25 and into 2026.
To avoid a repeat of the shortages experienced in the global electronic components market in 2022/3 customers should be placing longer term (12 month) scheduled order cover with their suppliers. This order cover can always be rescheduled to meet their organisation’s changing needs, but it has the advantage of providing components manufacturers with a much better indication of likely future demand, enabling them to schedule their investment and production capacity appropriately.
Concluding thoughts
Based on the current trajectory of the global electronic components market it looks likely that it will take at least five years (i.e. until 2030) before we see a return to 2022 sales revenue levels, unless there is a huge and unexpected increase in both demand and growth. Stranger things have happened.
I continue to encourage all partners in the electronic components supply network to actively and positively engage with their partners to negotiate and agree successful outcomes for all. It costs virtually nothing but the benefits of engagement with partners are always beneficial and enhances the performance of all players in our industry.
This article originally appeared in the Sept/Oct issue of Procurement Pro.

Author: Adam Fletcher Chairman of the Electronics Components Supply Network (ecsn)